Understanding the performance profile of your Node.js applications can be a difficult process, particularly while dealing with an ever-changing landscape in an evolving ecosystem.
In this post, I am going to explore looking at Node.js application performance using tools that are compatible with other programming languages, to provide a cross-language profiling toolset, that can be used on Linux systems with a recent Kernel.
We will be using a bunch of tools that are part of the Linux Kernel but don’t let that scare you, they are pretty simple once you understand the basics.
The first tool of the bunch is found in the “linux-tools” package and is suitably named perf, it can also be referred to as perf_events because poor SEO of perf and that the supporting documentation from Brendan Gregg and Vince Weaver uses perf_events. In our caseperf_events samples the Linux Kernel to provide a statistically relevant set of data of the runtime of your application without capturing all data points, that would either be too much or even more importantly slow down your application/machine.
How to collect performance samples
With perf_events available to use, we will now start to capture some data whilst our application is under load.
I am going to be using next.js to build a sample server-side rendered react application, which we will be using to show what these performance profiling tools will uncover.
(Note this might not work for you yet, as I have a PR in progress on the Node.js project to allow those parameters. PR #25565)
Once this application is up and running, you should be able to access it on http://localhost:3000. To produce some load on this application we will use an application named artillery which is a fantastic tool writing user-journey based load tests.
So, we now have our application running, and a sustained amount of load (150 arrivals per second), so the next step on our performance journey is to use perf_events to get an understanding of what is happening to it.
Let's deconstruct the perf command:
sudo perf record— Record the perf events, ran as sudo as we need to interface with the Linux Kernel.-F 99— Sample the application at this frequency, 99 instead of 100 to minimise lockstep sampling-g— Enables call-graph sampling, we will use this to make it easier to parse and make pretty graphs!-p $(pgrep -f next-start)— Find our node.js applications process id.-- sleep 60Run our record for 60 seconds
After our command has ran for 60 seconds, we should see some output in our terminal telling us that the perf command has captured data.
perf_events should have now created a perf.data file, and the node.js application should’ve created some logs files in the format of isolate-0x*-v8.log as well as some files /tmp/perf-*.map . To get a human readable version of the perf.data file, we can now run another command which will output to a file of our choice.
Now we have our raw data, lets use some tools to inspect what we have!
FlameScope
The first tool which we are looking at is something developed by Netflix which “uses subsecond offset heat maps and flame graphs to analyze periodic activity, variance, and perturbations.” I found out about this tool on Brendan Gregg’s blog post titled “FlameScope Pattern Recognition”.
Flamescope can be installed by following the instructions found on the Github repository: https://github.com/Netflix/flamescope once this is running, it will load any files found within the examples directory within the flamescope folder. We can view what we have been running by copying our stacks.test.xxxx files to the examples directory and investigate it at http://localhost:5000

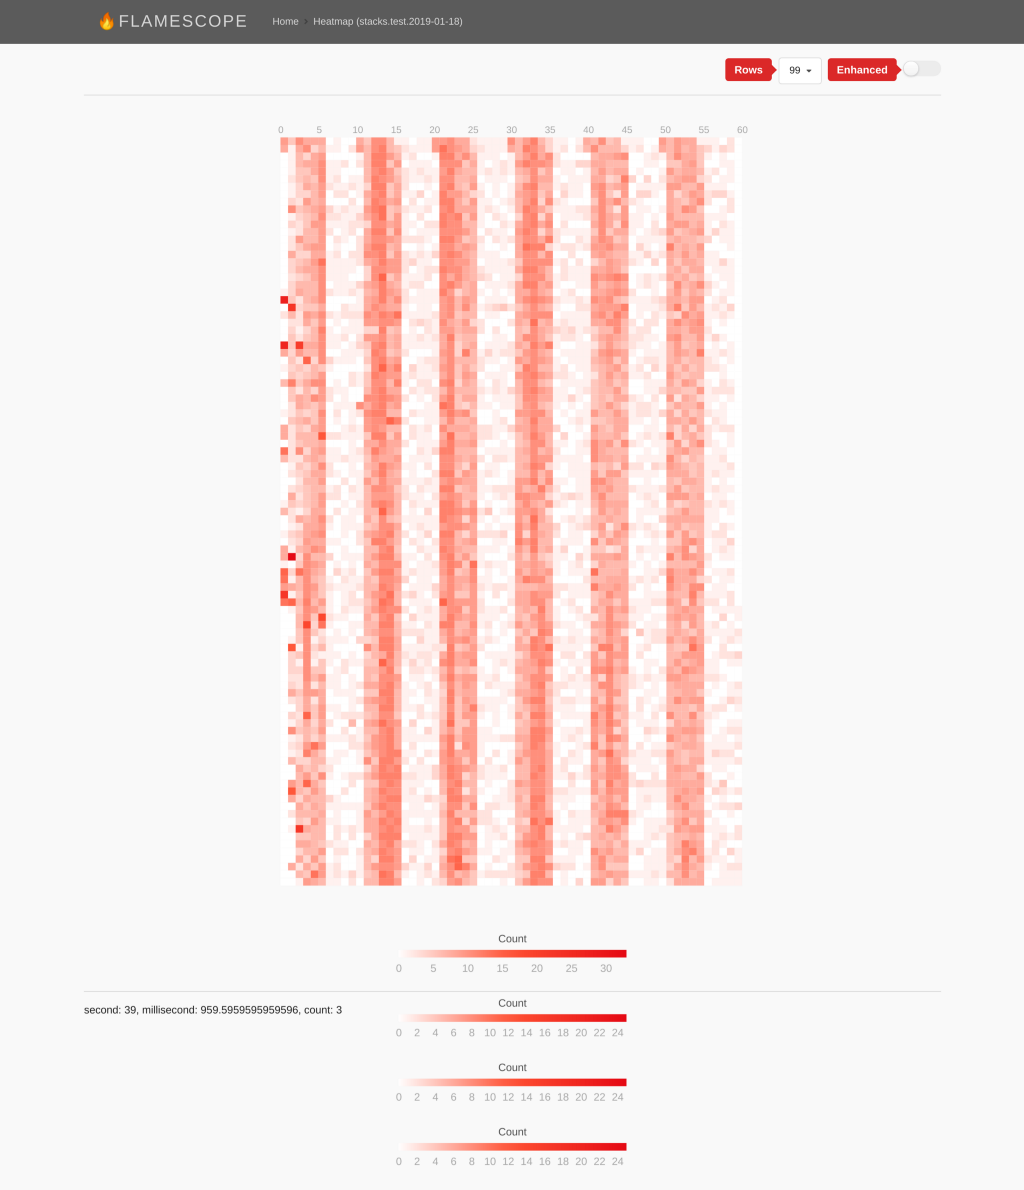
What we can see in the image to our left, is that although the arrivals per second are constant, we still see some variability in load every 5 seconds.
What could cause this?
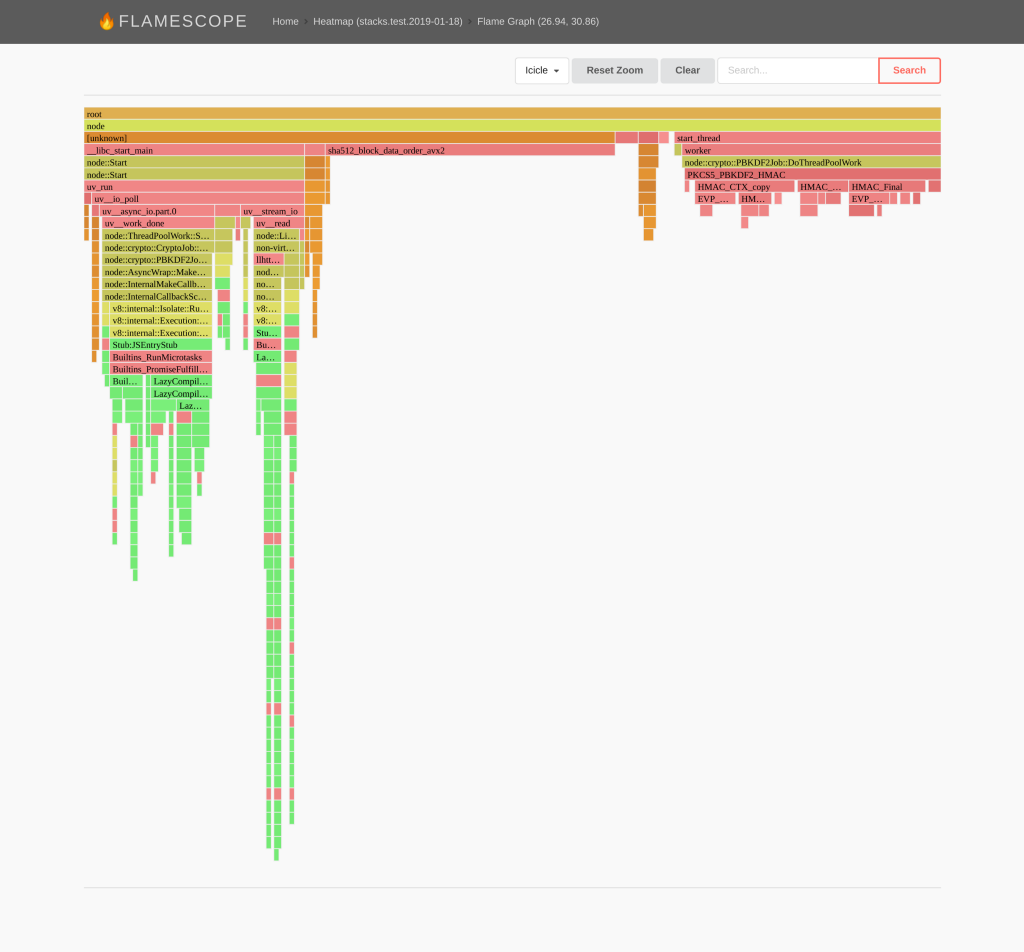
To further investigate, we can drill down into a flamegraph, which should show us what functions are taking up the most time. This is achieved by selecting a range within both the light coloured sections and the darker colour sections.
What becomes apparent is that in the darker sections we see that our applications is spending much longer in the “sha512_block_data_order_avx2” and the “node::crypto::PBKDF2Job::DoThreadPoolWork” sections. These functions are used by crypto.pbkdf2 to generate hashed passwords. https://github.com/tomgco/hello-next-performance/blob/master/pages/index.js#L20 Looking in deeper we can see that this application actually changes the strength of the password hash every 5 seconds (why, who knows! :D), explaining the pattern we see in the subsecond heatmap.

Finally, we can start to pin down some of our applications bottlenecks due to CPU utilisation. However, we all know that Node.js’ real strong point is the asynchronous I/O that it performs. This leads to the main performance impact on Node.js applications, functions that block the event loop.
Off-CPU analysis
Again I am going to refer back to another Brendan Gregg blog post “Linux eBPF Off-CPU Flame Graph”. Off-CPU can be achieved using the same tooling as earlier, but due to having to monitor the scheduler (which scales with load) it can very quickly become a huge overhead (think around a million events a second).
eBPF overcomes this limitation, for more details why, I recommend you check out the linked post.
So follow me as we dive into some off-CPU analysis.
For this example, we are going to take a different application https://github.com/tomgco/hello-next-performance/tree/io-bottle-neck, but follow mostly the same procedure.
- Build and run the application with the correct node options —
NODE_OPTIONS="--perf-prof --perf-prof-unwinding-info --perf-basic-prof" npm run start - Simultaneously run a load test —
artillery quick -r 5 -d 0 http://127.0.0.1:3000/
The next step is now to install and use the bcctools from iovisor, once installed you should have an application named offcputime in /usr/share/bcc/tools (Or wherever your distribution installs them). This tool will allow us to capture the frames to dive deeper into the performance issues of the application. We are also going to be using a tool to generate a flamegraph from the data, which is another amazing tool from, you guessed it, Brendan Gregg named flamegraph.pl.
Whilst running artillery I also took note of the latencies we had from our application, which was:
Shall we see if we can reduce these values?

To make things easier for this blog post I have removed some lines from the outputted file, to make the SVG easier to read.
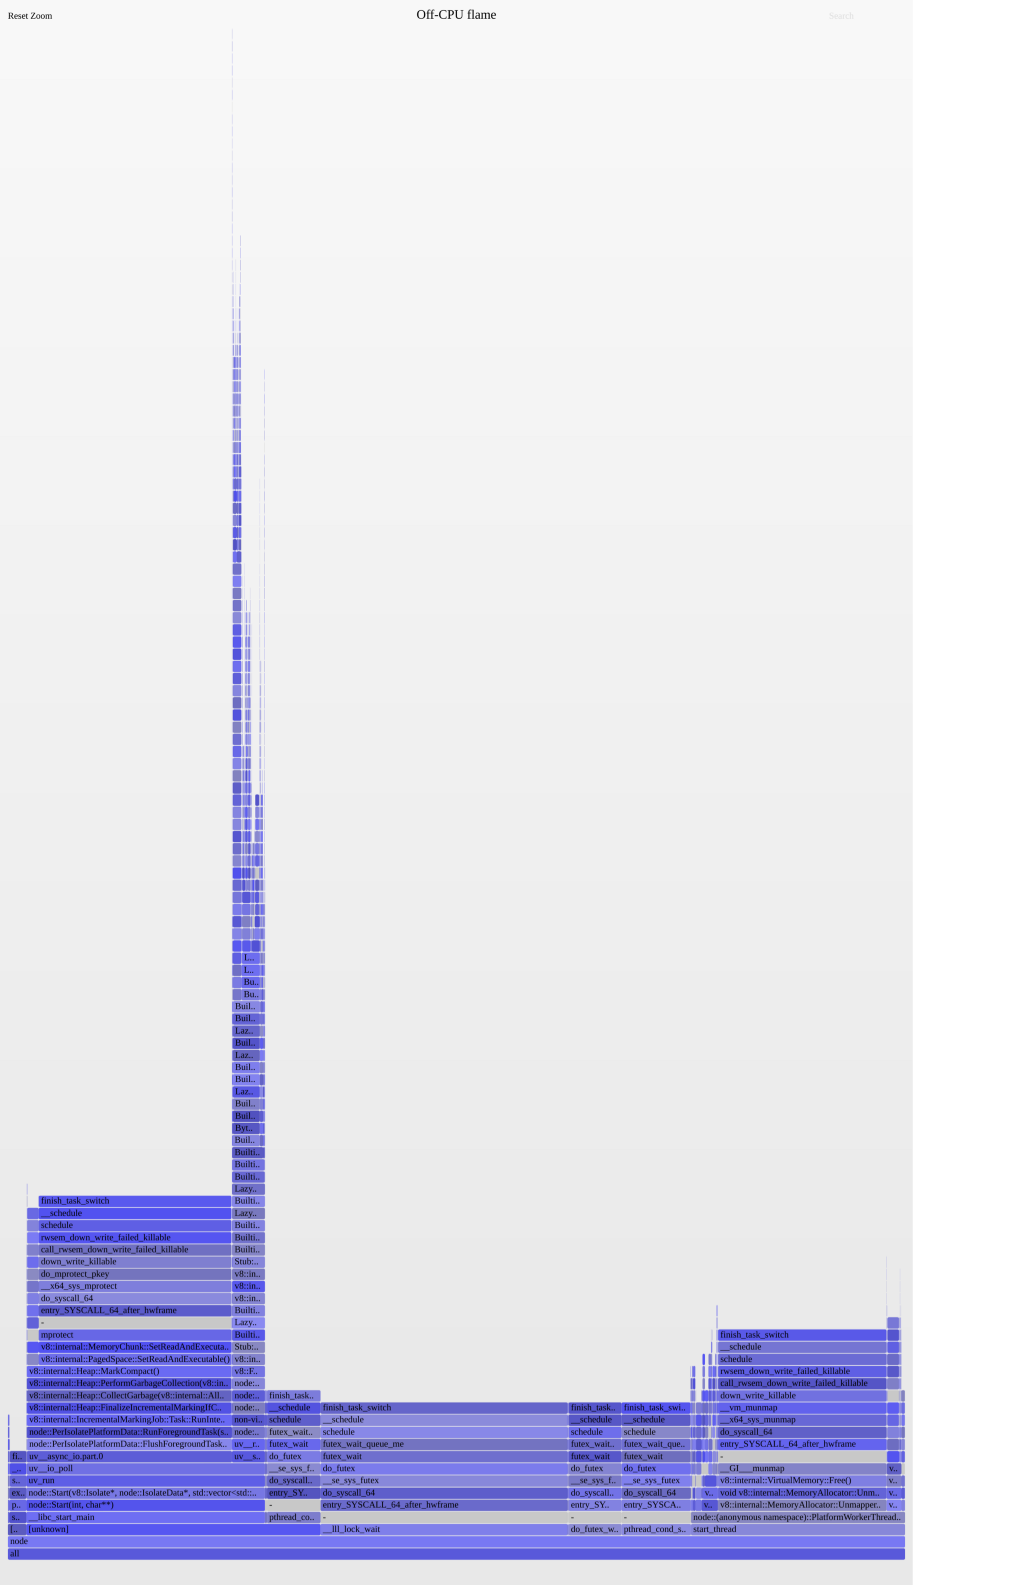
As you see in fig.1 the large towers contain the areas which contain the blocking I/O and the large fat lower towers are where a lot of time is spent.
A lot of the main time is caused by Garbage Collection and Memory Allocations, which is a good indication of the error at hand.
However, because this happens outside of the code routine of our application, it is very difficult to find out what is causing this.
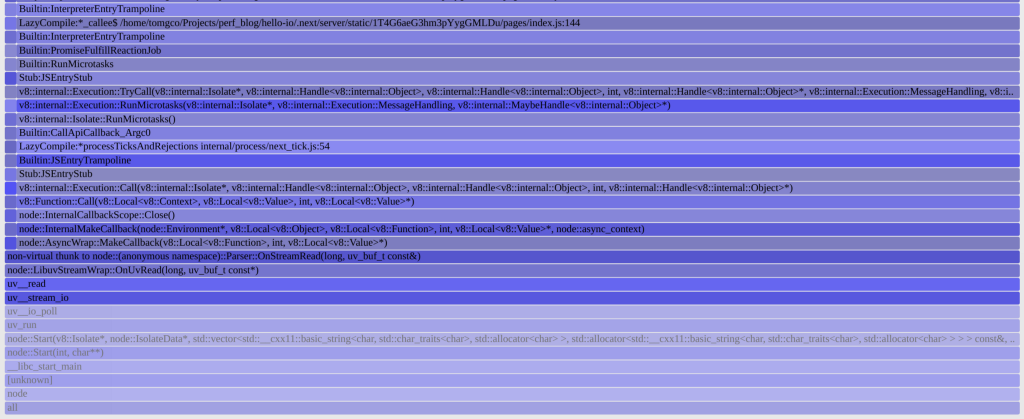
So if we ignore this and drill into the large slim tower, hopefully, we will start to see lines of code in our application being referenced.

Here we can see the generated code by next.js and see a reference to our pages/index.js on line 144. We can also see that next is transpiling our application to a .next/ folder, by inspecting that we can see it is referencing our large array which we are populating for every request! Success!
With our new knowledge, I am going to optimise this code by caching the whole page, if the details haven’t changed! I followed the simple steps from this post https://medium.com/@az/i18n-next-js-app-with-server-side-rendering-and-user-language-aware-caching-part-1-ae1fce25a693 to include our own express application, with the implementation of an LRU cache.
After running artillery again, I begin to see a reduced response time for the whole application:

These figures are so much smaller than what we had before!
It now simplifies our off-CPU flamegraph, almost totally removing our GarbageCollection block, eliminating our code block which was blocking our application. Check out the source here! https://github.com/tomgco/hello-next-performance/tree/cached-server
As you have seen, using tools like the above in a load testing/production environment allows you to begin to understand the performance profile of your applications as well as gain a quick visual understanding of what your application is actually doing!
And the best thing with this tooling is that you don’t need to use it exclusively with Node.js, you can apply your knowledge here to other languages! Compiled or Jitted!


